Product code: TAK
TAKT Time 30-Minute Production RateTracker® Magnetic Dry-Erase Whiteboard Systems
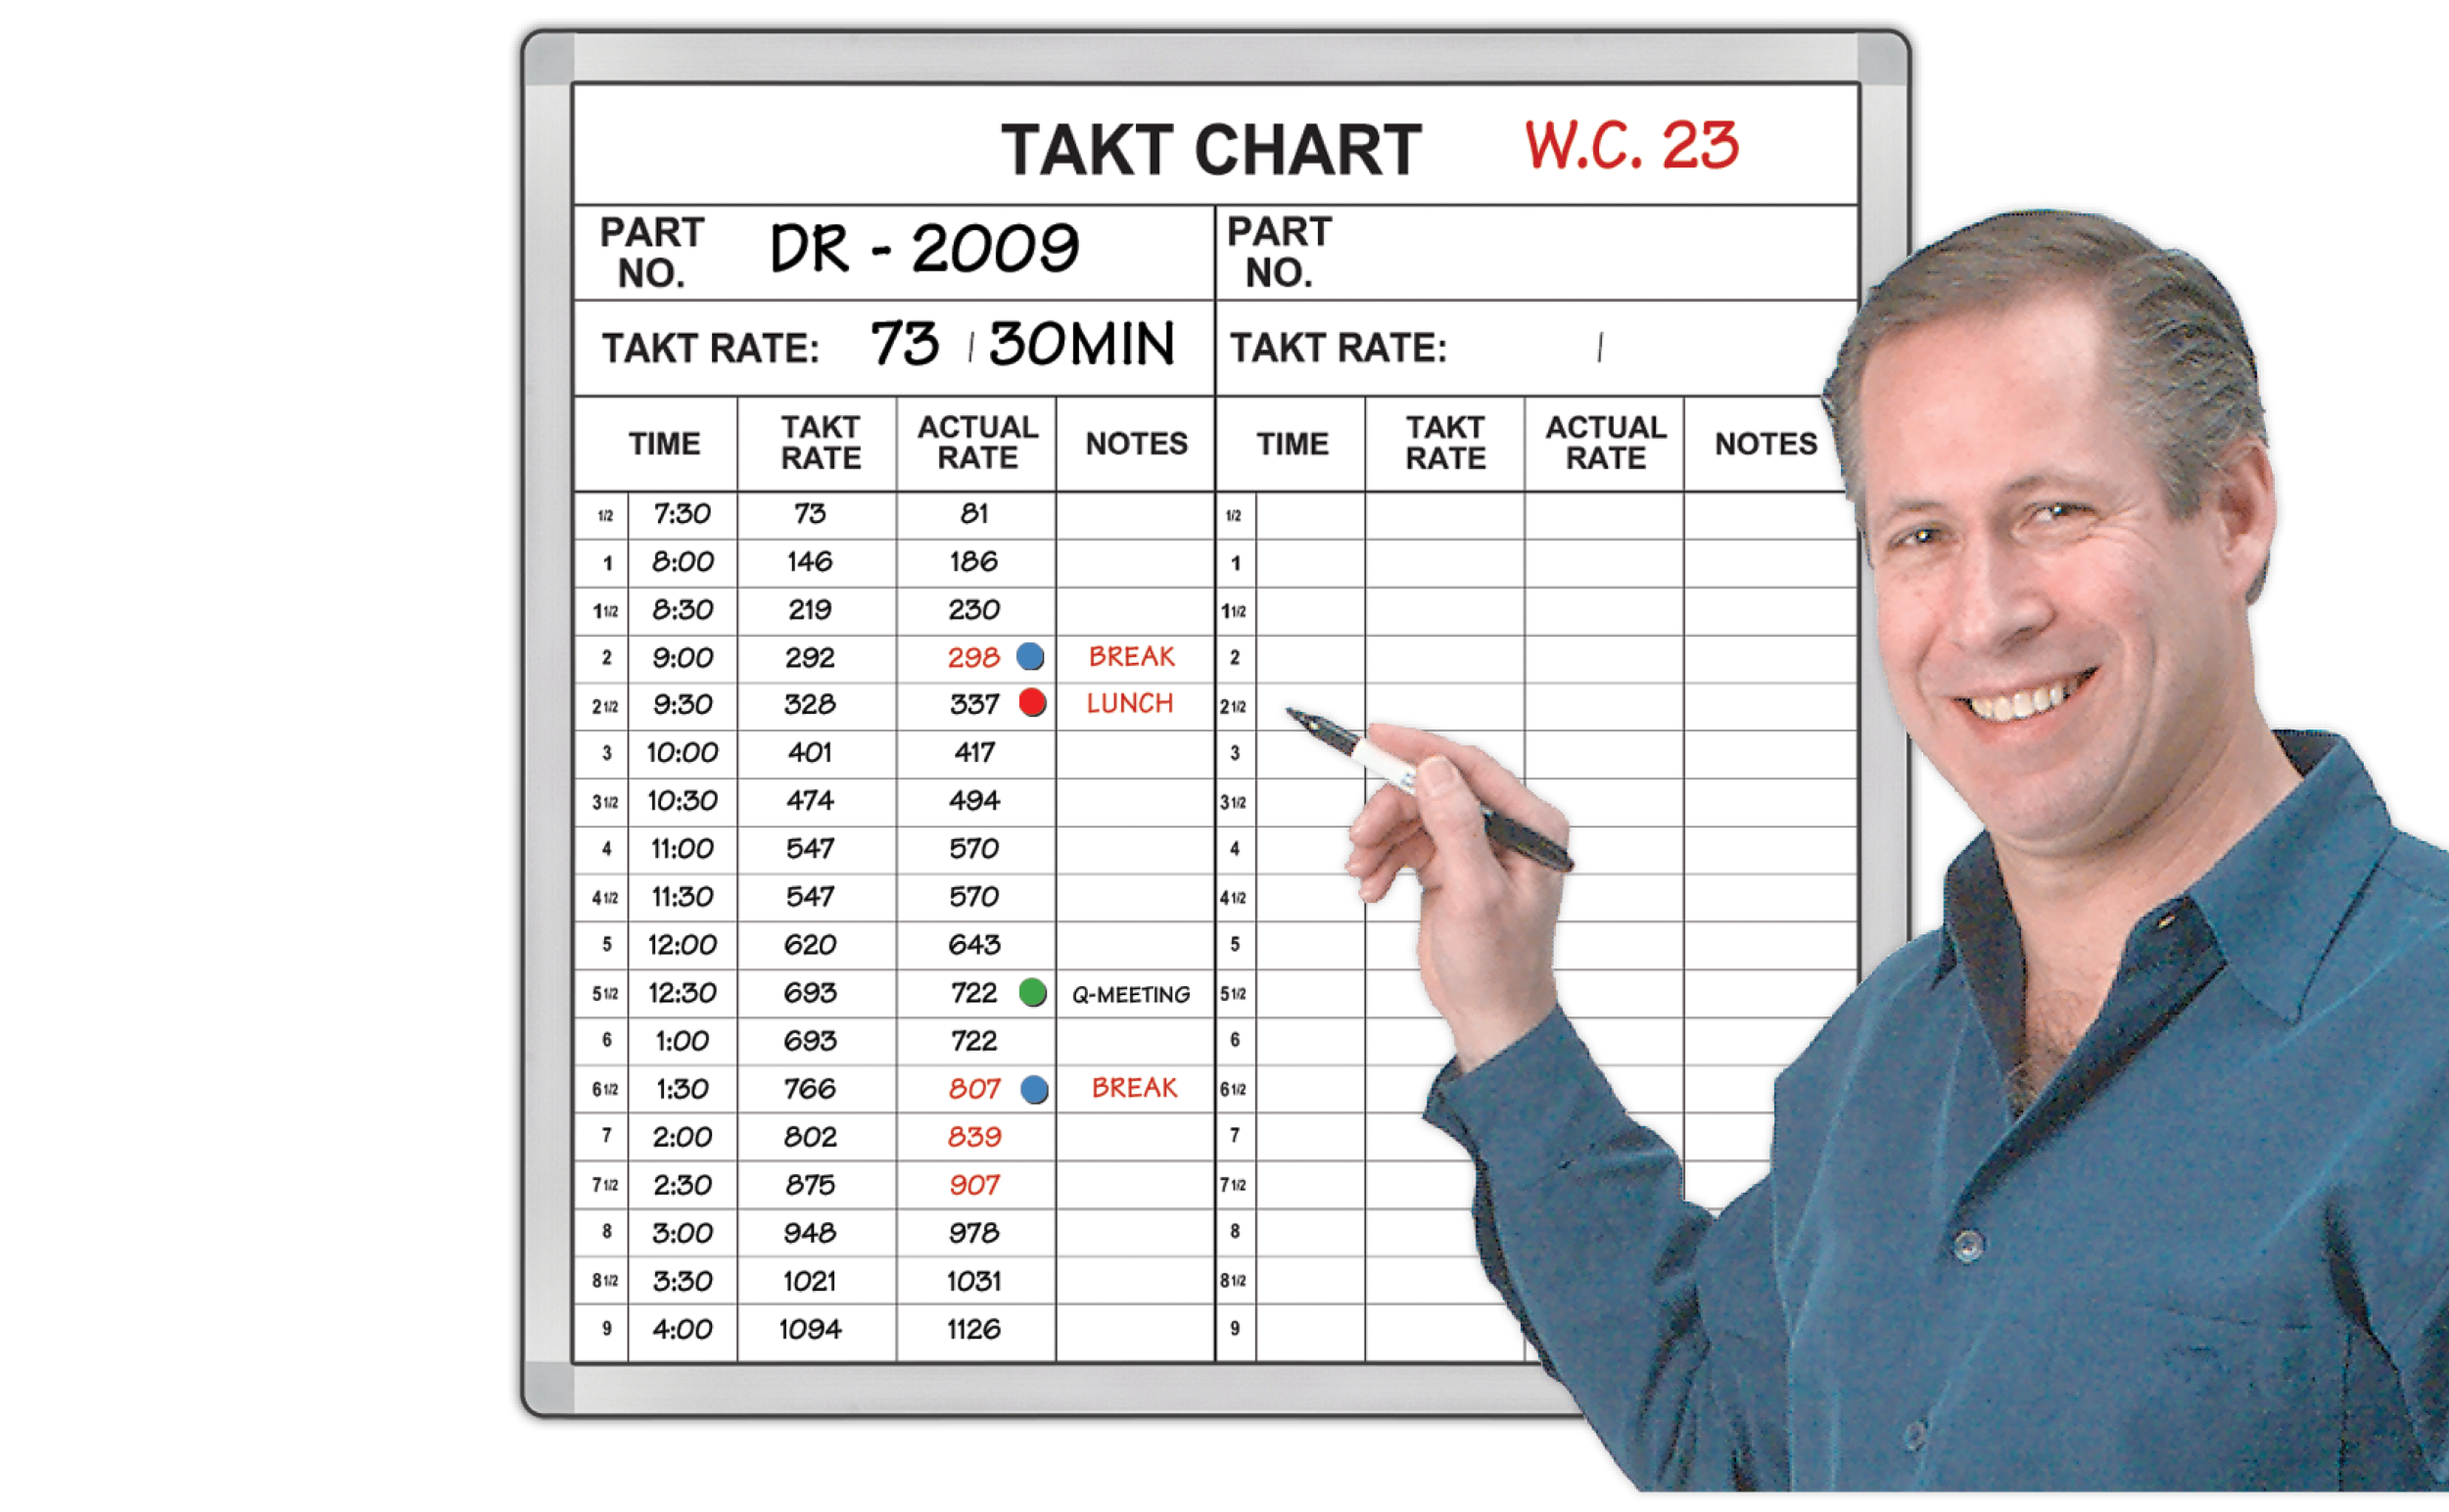
TAKT time charts are the standardized essential means for measuring the productivity cost of your work stations.. 3 Sizes with 2, 3 or 6 charts
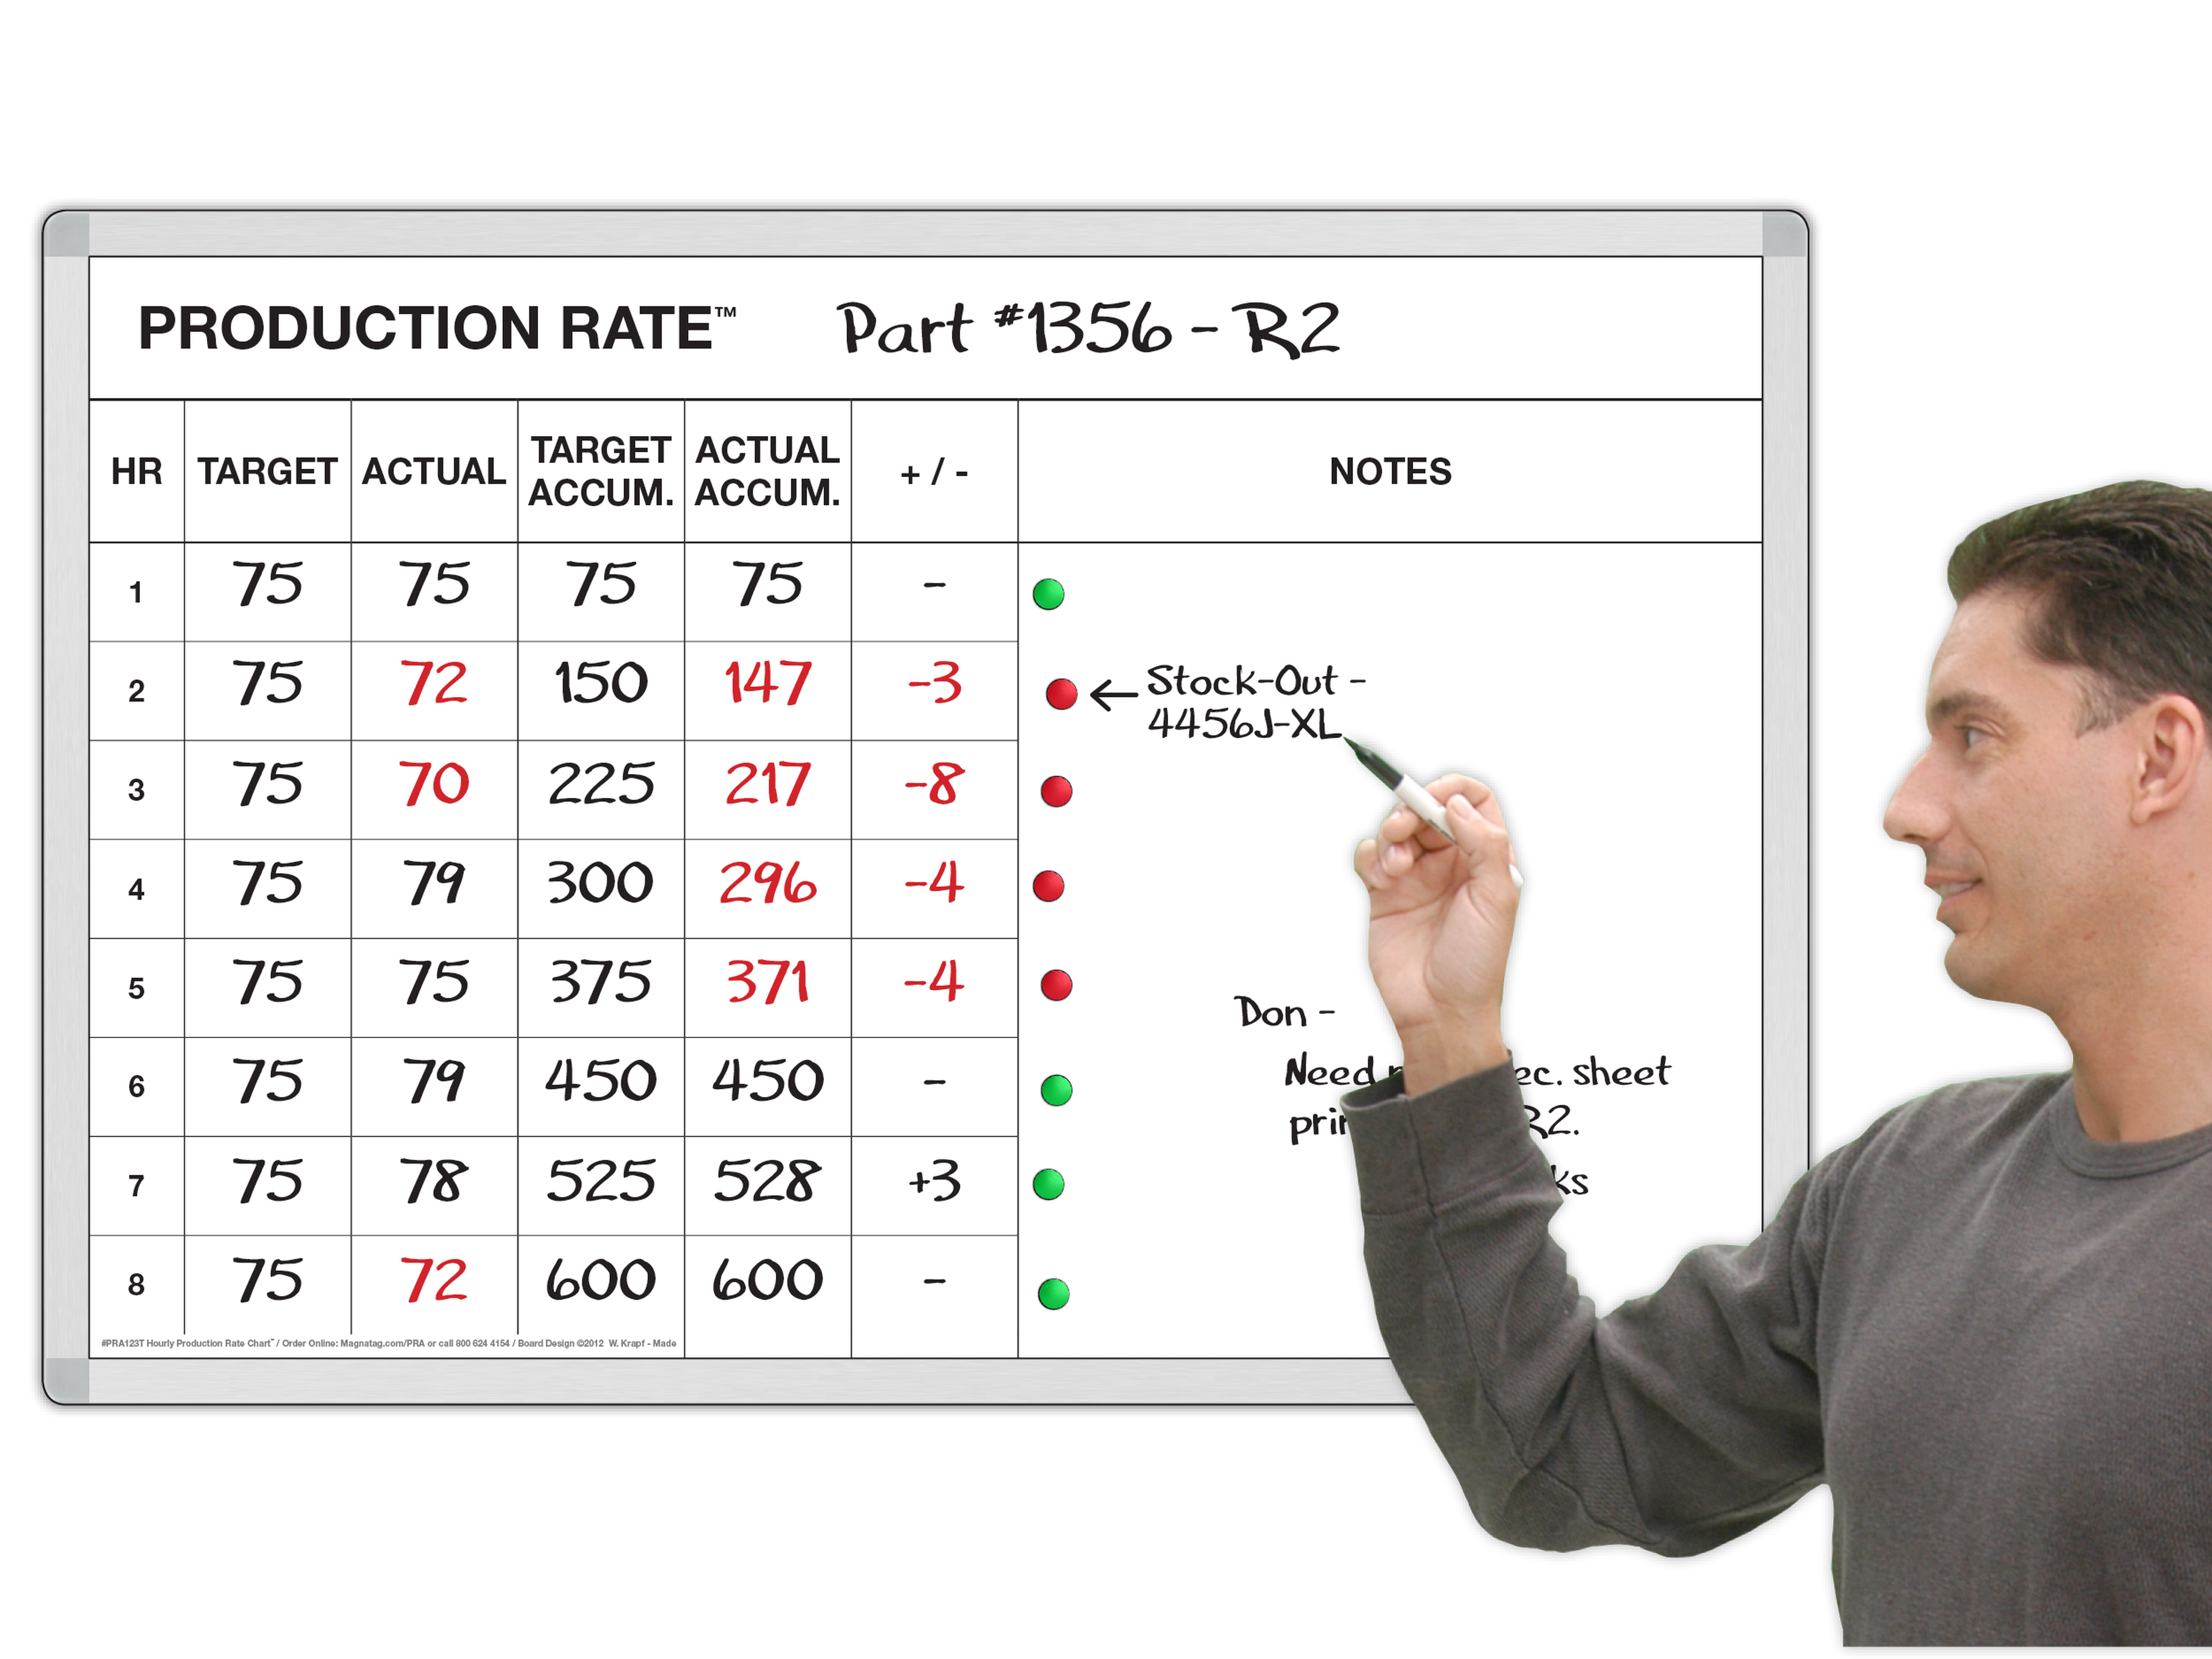
Track and compare the TAKT time actual accumulated production yield through an 8-hour cycle against the accumulated target rate in 30 minute increments. Includes a column for notes. Post 30 minute actual accumulated production performance against the accumulated TAKT Time Rate and write notes opposite any rate slowdown or stoppage. Use the 10 magnet signal colors to quickly code the type of action (red = scrap buildup, green = off tolerance, etc.). Select from models for 2, 3 or 6 shifts. These can also be used as TAKT time Charts for 2, 3 or 6 different parts.

If you would like some help from one of our experienced design specialists, please contact us or call us at 800 624 4154 or email us at sales@magnatag.com

Customize online at NO extra cost
You can personalize titles and headers on your board using our Design-it Editing tool. To access the tool look for the  symbol before adding to your cart
Order Here
Capacities, sizes and options
Ships in 5 business days or less!
FAQs
Frequently asked questions about this product