Magnatag InSight
The whiteboard and how it helps us brainstorm, innovate, motivate and create
RECENT BLOG POSTS
7‑Second Visual Management Checklist: Ensure Teams Deliver What Leaders ExpectHow to Avoid Branding Mistakes When Creating a Custom Whiteboard7 Proven Visual Management Tactics to Close Production GapsMastering the Gemba Walk: A Comprehensive Guide to Its Importance and Execution7 Essential Steps for Leaders to Run Effective Gemba WalksThe Definitive Guide to Hospital Communication Boards for Patient Rooms
CATEGORIES
Visual Management, Safety and the 6S Facility
Fri Mar 18 2016By:Mike P
The following post was contributed by Greg Hernandez, the Marketing Manager at R.W. Lyall
At Lyall, we’ve been manufacturing and engineering natural gas piping components for over 45 years—a span of time that often piques the curiosity of startup leaders I run into from day to day. Many of them assume there must be some great secret to how, in such a historically volatile market, we’ve been able to not only stick around but grow from one to three manufacturing facilities, all across the U.S., and all filled with happy, long-time employees.
The truth is, it’s not much of a secret at all. It’s just plain old lean manufacturing practices. One of the most valuable of the lean manufacturing elements at Lyall has also been one of the most well-known—“6S”. This practice is based on a lean philosophy called “5S,” which represents five Japanese words relating to discipline, cleanliness and order in the factory environment. In a sense, 6S is just like 5S, only with the concept of safety added in and brought front and center. And, while 6S is just one among many lean manufacturing components, it’s certainly been the cornerstone of Lyall’s lean production system.
For those as curious about the lean journey as my startup friends, here’s a quick overview of how the main components of the 6S facility— Sort, Straighten, Shine, Standardize, Sustain and Safety—fit into the bigger picture we call a “6S facility.”
Above All, the 6S Facility Is Safe
So simple yet so critical, organization and cleanliness bring immeasurable financial and social rewards because they streamline processes and keep things safe like nothing else can. Consider this scenario: A design engineer working in a typical factory environment might spend one or two extra minutes a couple of times a day looking for misplaced tools or materials. This same worker might spend 30 seconds or so a few times a day navigating through haphazardly placed equipment to get from one station to another. These few minutes and seconds here and there don’t seem like a big deal until you start doing the math. Take this one worker, add up the daily wasted time, multiply that by 245 days, and then multiply that by however many employees you have running the floor. The number will surprise you. Now add to the equation some lost time due to injury, and the number will leave your head spinning.
In a clean and organized facility, all materials and tools are conveniently located, workstations are uncluttered, and the floor layout is intentionally designed to facilitate efficiency. Not only does this save money directly, it also protects your valuable workers from harm and provides them with needed stress relief. Little frustrations and inconveniences peppered throughout the day can add up and wear down even the most positive person. We’ve all seen it, and we’ve all been there.
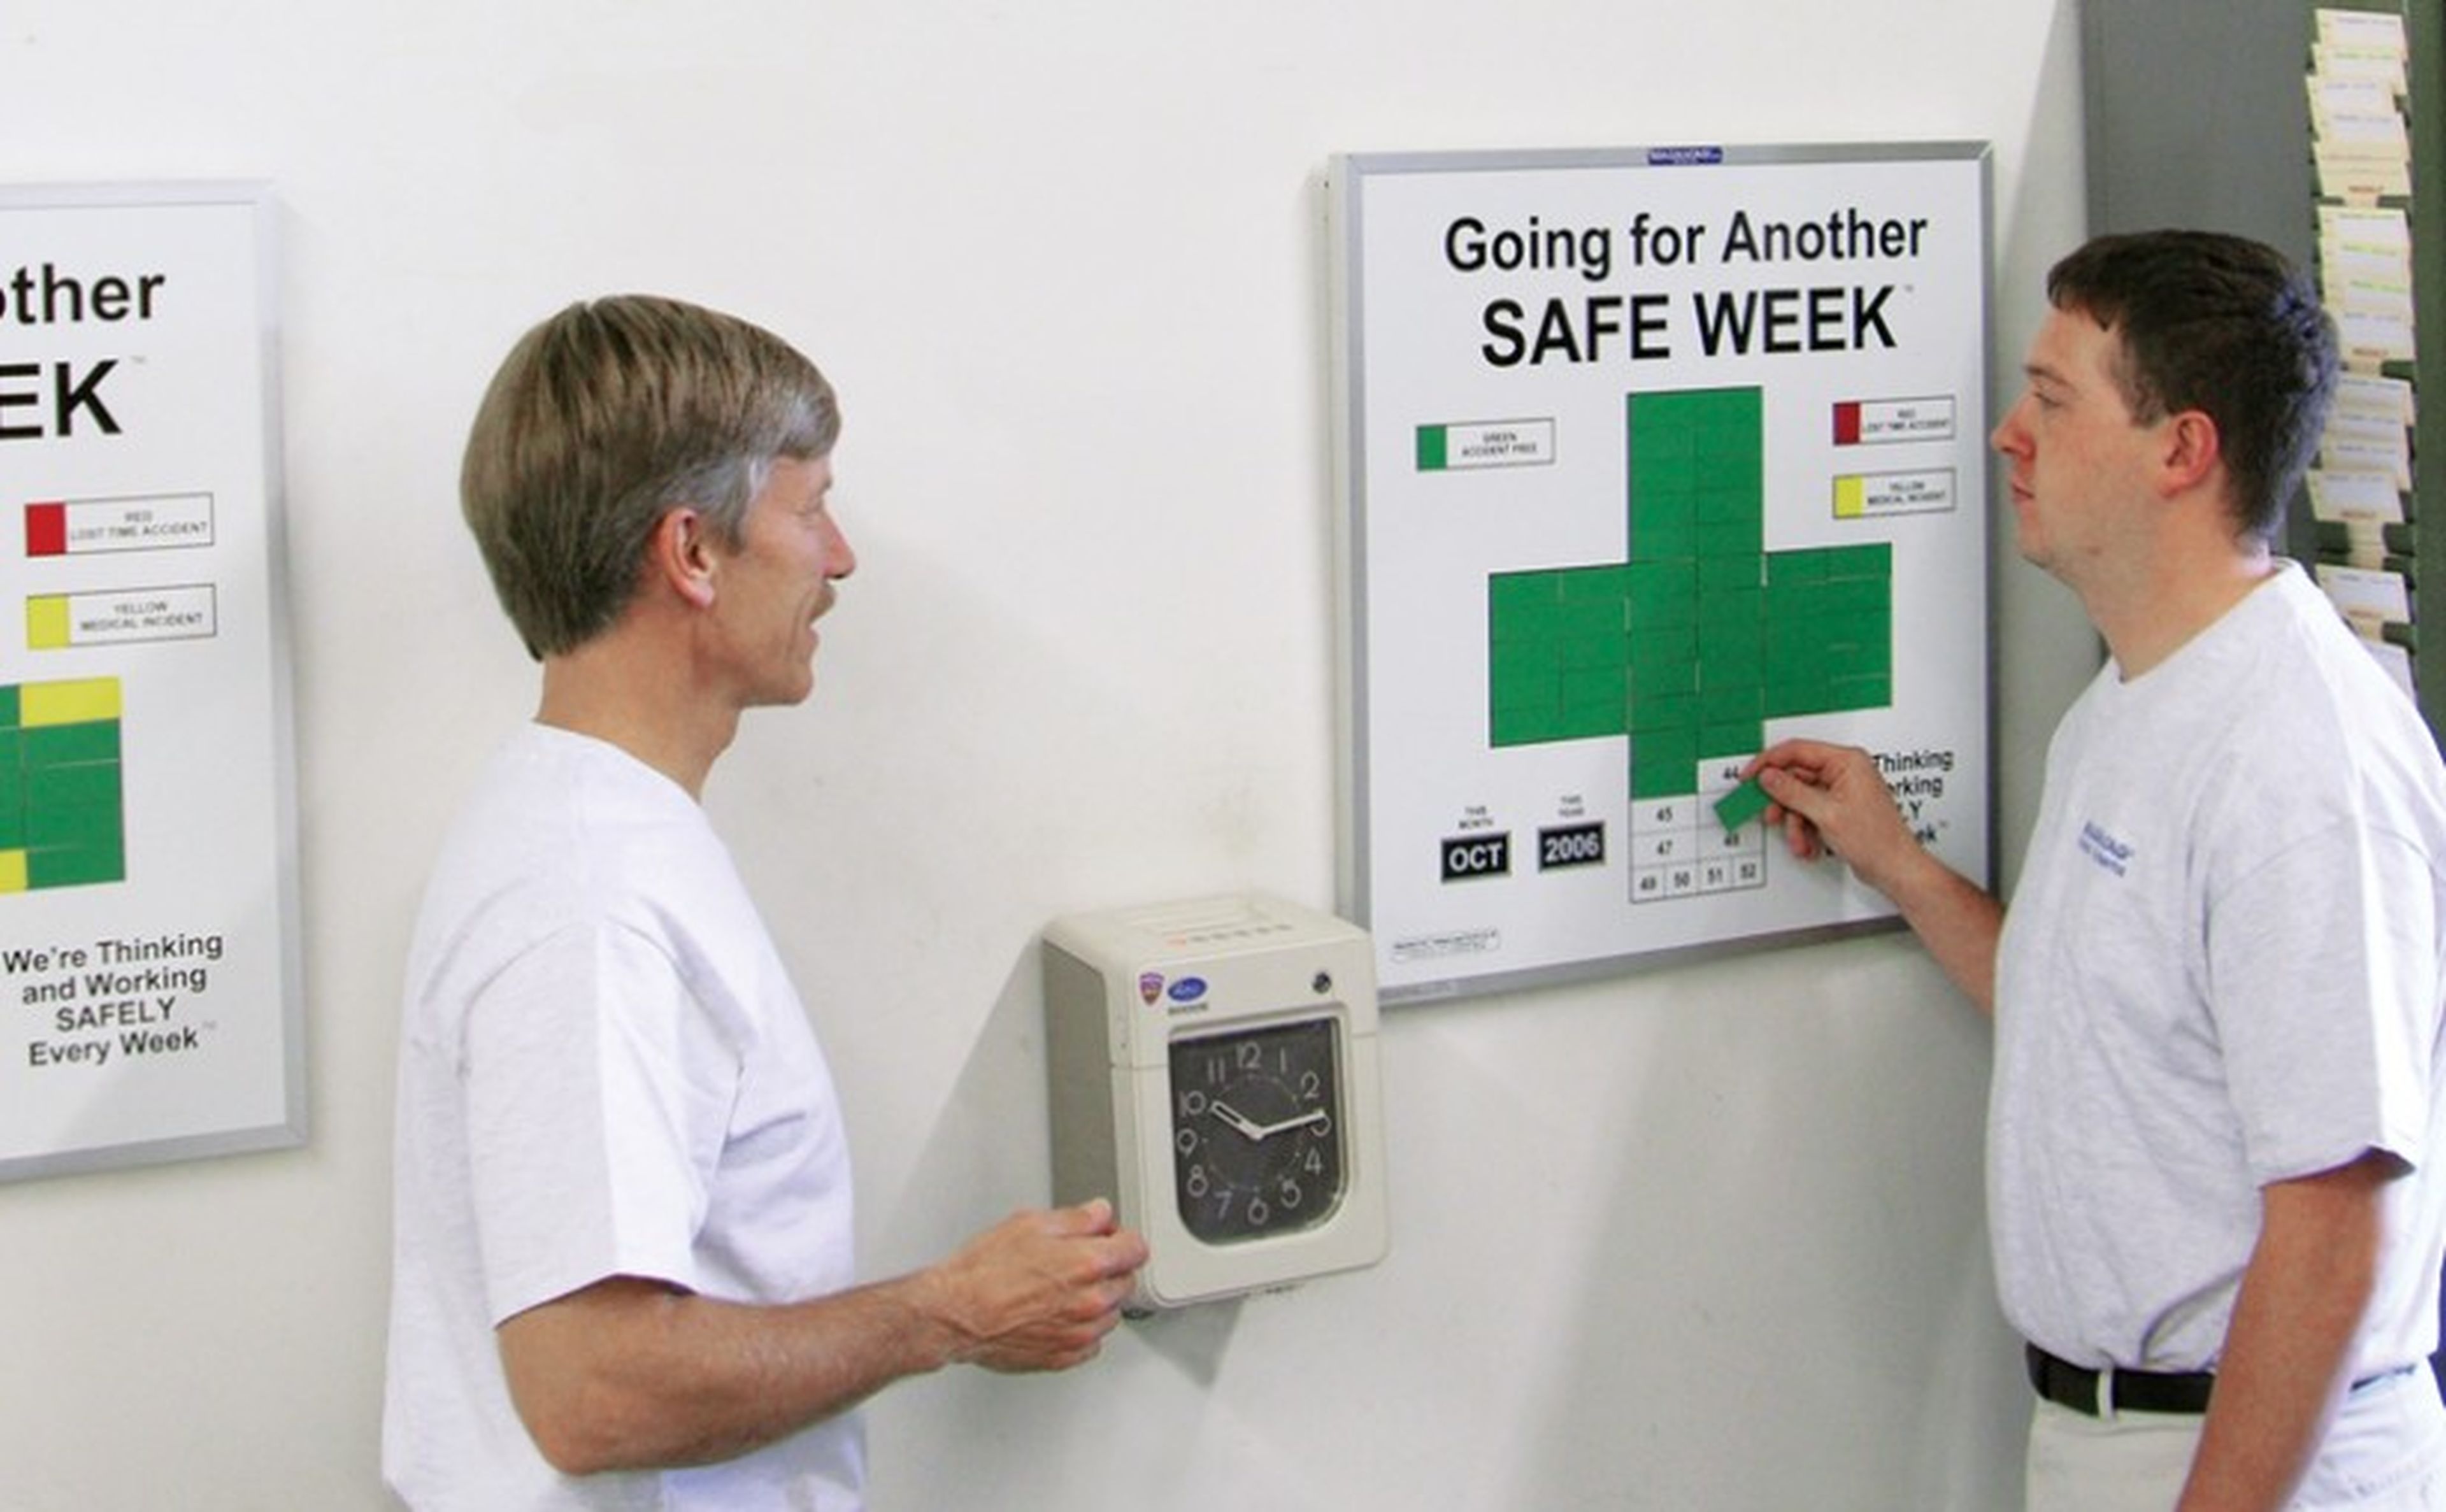
It’s Also Exceedingly Visual
I use the word exceedingly because the visual component in the exemplary 6S facility will always be wonderfully extreme. That’s because the highly accessible visual presentation of all goals and measures gives everyone—from engineers and managers to operators—a common understanding of the process and the standards. This common understanding allows individuals to align their actions and choices with the company’s strategic direction and creates a company culture characterized by shared successes and a common desire to keep things safe. The effect is powerful.
One of the best descriptions of visual management I’ve heard comes in the form of an analogy by Charles Standard and Dale Davis, authors of the book, Running Today's Factory. The analogy, which appears in their article, “Visual Management: More than Just a Pretty Plant,” compares the visual facility to sports fans, and its visual components (charts, boards, etc.) to the scoreboard in a game.
The writers refer specifically to baseball, asking us to consider why fans are constantly glancing up at the scoreboard when all the action is down on the playing field. This, they say, is because the scoreboard reveals how the team is doing in relation to the goal of winning the game. It gives us some really important information, including what’s being measured, what it means to win the game, what needs to happen to win, and whether our team is winning or even has a chance at winning.
Standard and Davis go on to talk about how the scoreboard also gives us critical real-time information about other factors in the game, such as which inning we’re in, the count, whether the last pitch was a ball or strike, as well as the number of outs, hits and errors.
From a psychological perspective, the scoreboard also keeps fans interested in the game. The writers share how it “provides unambiguous feedback about performance. It presents the same information to everyone, whether owner, manager, player, or spectator. Most importantly, it keeps us focused on the measures that are important and lets us know what must be done to win the game.”
To explain the analogy, Standard and Davis point out that visual management gives us that same kind of real-time information about the facility’s status. That is, it affords us shared access to an easy-to-understand visual representation of our key measures and goals and the facility’s performance in relation to those goals (for everything from daily production to long-term safety goals). It also allows us to see, quite literally, the factors preventing us from reaching our goals and how our individual efforts can contribute to the company’s success.
So if you’re looking to go lean, here’s our best advice. First, take the macro approach: Conduct a visual survey of your facility to identify the obvious areas in need of cleanup and organization. Then, get busy understanding the micro operations: Talk to your team members and ask them to share their thoughts on the smaller processes they engage in each day. How might these processes be made safer, easier, faster, less stressful? And, finally, get busy building your scoreboard—the charts, signs and graphics that will allow you and your employees to fully understand (and, therefore, start operating to meet) the shared goal of safety and success.
About R.W. Lyall: Lyall was founded in 1970 by Robert W. Lyall, who built the company with the intent of manufacturing the best pipeline components available to the natural gas industry. With an emphasis on quality and a business philosophy that puts the needs of the customer above all else, Lyall succeeded in that mission. Today, his children and the entire Lyall team maintain this legacy of quality with continually expanding operations across North America. Lyall’s Continuous Improvement accomplishments have been highly recognized and included in numerous newspaper and magazine articles and books relating to operational and manufacturing excellence. The company’s doors are always open to organizations interested in deploying a lean production model. Lean tours are given almost weekly to associations, universities, and other companies dedicated to operational and manufacturing excellence.
At Lyall, we’ve been manufacturing and engineering natural gas piping components for over 45 years—a span of time that often piques the curiosity of startup leaders I run into from day to day. Many of them assume there must be some great secret to how, in such a historically volatile market, we’ve been able to not only stick around but grow from one to three manufacturing facilities, all across the U.S., and all filled with happy, long-time employees.
The truth is, it’s not much of a secret at all. It’s just plain old lean manufacturing practices. One of the most valuable of the lean manufacturing elements at Lyall has also been one of the most well-known—“6S”. This practice is based on a lean philosophy called “5S,” which represents five Japanese words relating to discipline, cleanliness and order in the factory environment. In a sense, 6S is just like 5S, only with the concept of safety added in and brought front and center. And, while 6S is just one among many lean manufacturing components, it’s certainly been the cornerstone of Lyall’s lean production system.
For those as curious about the lean journey as my startup friends, here’s a quick overview of how the main components of the 6S facility— Sort, Straighten, Shine, Standardize, Sustain and Safety—fit into the bigger picture we call a “6S facility.”
Above All, the 6S Facility Is Safe
So simple yet so critical, organization and cleanliness bring immeasurable financial and social rewards because they streamline processes and keep things safe like nothing else can. Consider this scenario: A design engineer working in a typical factory environment might spend one or two extra minutes a couple of times a day looking for misplaced tools or materials. This same worker might spend 30 seconds or so a few times a day navigating through haphazardly placed equipment to get from one station to another. These few minutes and seconds here and there don’t seem like a big deal until you start doing the math. Take this one worker, add up the daily wasted time, multiply that by 245 days, and then multiply that by however many employees you have running the floor. The number will surprise you. Now add to the equation some lost time due to injury, and the number will leave your head spinning.
In a clean and organized facility, all materials and tools are conveniently located, workstations are uncluttered, and the floor layout is intentionally designed to facilitate efficiency. Not only does this save money directly, it also protects your valuable workers from harm and provides them with needed stress relief. Little frustrations and inconveniences peppered throughout the day can add up and wear down even the most positive person. We’ve all seen it, and we’ve all been there.
It’s Also Exceedingly Visual
I use the word exceedingly because the visual component in the exemplary 6S facility will always be wonderfully extreme. That’s because the highly accessible visual presentation of all goals and measures gives everyone—from engineers and managers to operators—a common understanding of the process and the standards. This common understanding allows individuals to align their actions and choices with the company’s strategic direction and creates a company culture characterized by shared successes and a common desire to keep things safe. The effect is powerful.
One of the best descriptions of visual management I’ve heard comes in the form of an analogy by Charles Standard and Dale Davis, authors of the book, Running Today's Factory. The analogy, which appears in their article, “Visual Management: More than Just a Pretty Plant,” compares the visual facility to sports fans, and its visual components (charts, boards, etc.) to the scoreboard in a game.
The writers refer specifically to baseball, asking us to consider why fans are constantly glancing up at the scoreboard when all the action is down on the playing field. This, they say, is because the scoreboard reveals how the team is doing in relation to the goal of winning the game. It gives us some really important information, including what’s being measured, what it means to win the game, what needs to happen to win, and whether our team is winning or even has a chance at winning.
Standard and Davis go on to talk about how the scoreboard also gives us critical real-time information about other factors in the game, such as which inning we’re in, the count, whether the last pitch was a ball or strike, as well as the number of outs, hits and errors.
From a psychological perspective, the scoreboard also keeps fans interested in the game. The writers share how it “provides unambiguous feedback about performance. It presents the same information to everyone, whether owner, manager, player, or spectator. Most importantly, it keeps us focused on the measures that are important and lets us know what must be done to win the game.”
To explain the analogy, Standard and Davis point out that visual management gives us that same kind of real-time information about the facility’s status. That is, it affords us shared access to an easy-to-understand visual representation of our key measures and goals and the facility’s performance in relation to those goals (for everything from daily production to long-term safety goals). It also allows us to see, quite literally, the factors preventing us from reaching our goals and how our individual efforts can contribute to the company’s success.
So if you’re looking to go lean, here’s our best advice. First, take the macro approach: Conduct a visual survey of your facility to identify the obvious areas in need of cleanup and organization. Then, get busy understanding the micro operations: Talk to your team members and ask them to share their thoughts on the smaller processes they engage in each day. How might these processes be made safer, easier, faster, less stressful? And, finally, get busy building your scoreboard—the charts, signs and graphics that will allow you and your employees to fully understand (and, therefore, start operating to meet) the shared goal of safety and success.
About R.W. Lyall: Lyall was founded in 1970 by Robert W. Lyall, who built the company with the intent of manufacturing the best pipeline components available to the natural gas industry. With an emphasis on quality and a business philosophy that puts the needs of the customer above all else, Lyall succeeded in that mission. Today, his children and the entire Lyall team maintain this legacy of quality with continually expanding operations across North America. Lyall’s Continuous Improvement accomplishments have been highly recognized and included in numerous newspaper and magazine articles and books relating to operational and manufacturing excellence. The company’s doors are always open to organizations interested in deploying a lean production model. Lean tours are given almost weekly to associations, universities, and other companies dedicated to operational and manufacturing excellence.
Categories:Factory and Production